Legal Representation and Eviction Outcomes in Tulsa County

Tulsa has the 11th highest eviction rate among American cities, with more than 14,000 cases filed each year and 7,000 granted. Evictions have enormous, long-term destabilizing effects on families, and cities and counties spend millions each year to address the emergency needs of displaced residents. Some cities and states have begun providing legal representation to all tenants who have an eviction filed against them in order to protect their rights and reduce displacement.

This research brief examines the relationship of legal representation and eviction case outcomes in Tulsa County. Statistical analysis of data collected by Open Justice Oklahoma of eviction cases in Tulsa County from 2010 through 2020 shows that legal representation is significantly associated with greater odds of a tenant remaining in their home.

Click here to download the research brief on Legal Representation and Eviction Outcomes in Tulsa County.

Methodology

This research brief examines the impact of legal representation on small claims eviction outcomes in Tulsa County District Court using data collected from online court records. To estimate the effect size of legal representation on eviction judgments in Tulsa County, we use a binary classification model with two binary predictors and one binary outcome variable. The predictors indicate whether or not a plaintiff has legal representation, and whether a defendant has representation. A value of zero indicates no representation, or a pro se case, while a value of one indicates that the party is represented in court. The outcome variable of the model indicates whether the case disposition results in a judgment against the tenant. A value of zero indicates a judgment favorable to the tenant, whereas a value of one indicates a case outcome which results in eviction.

Click here to download the research brief on Legal Representation and Eviction Outcomes in Tulsa County.

High-Volume Tulsa Eviction Filers

This research brief examines the most frequent filers of small claims eviction cases in Tulsa County in 2019 and 2020.

Data collected by Open Justice Oklahoma show that a small number of the most frequent plaintiffs account for a large portion of filings in this time period.

Click here to download the research brief High-Volume Tulsa Eviction Filers.

Methodology

Open Justice Oklahoma collects and analyzes court records publicly available on the Oklahoma State Court Network website (oscn.net). This analysis uses small claims cases filed in 2019 and 2020 in Tulsa County. The plaintiff is identified as the first plaintiff on the party list. We attempt to standardize plaintiff names that contain typographical errors and inconsistencies, but some duplicates likely remain in the list. Our plaintiff standardization method reduced the number of unique names from 3,280 to 2,871.

Click here to download the research brief High-Volume Tulsa Eviction Filers.

Juvenile crime plummets in Oklahoma, but racial and local disparities remain

Executive Summary

Oklahoma has experienced a massive decline in criminal arrests of youth under age 18 over the last 25 years, with a particularly large drop among the youngest ages. Juvenile crime rates now stand at their lowest level in the five decades of state reports. Commensurate with plummeting arrest numbers and rates, the state Office of Juvenile Affairs reports large decreases in incarcerations of youth. The decline in youth coming in to the justice system has been followed by declines in arrests among young adults and suggests there will be decreased crime and imprisonment among older adults as well in coming years.

Oklahoma’s youth crime rates have fallen for all ages and races.

Since 1990, violent felonies fell by 70 percent and property felonies by 86 percent among Oklahoma youth of all races. Drug and other offenses also declined substantially. Arrest rates of children under age 13 fell by 92 percent.

Crime declined as Oklahoma youth became more racially diverse.

The declines in crime, violence, and incarceration among youth coincided with the growth of immigrant and Native American populations. In 1990, 25 percent of Oklahoma’s youth age 10-17 were of color (Hispanic, Black, Asian, or Native American). Today, in a youth population that is 70,000 larger, the nonwhite share has risen to 43 percent.

Declining crime occurred as incarcerations and control measures aimed at youth diminished.

State incarcerations of youth fell from 757 in 1999 to 270 in 2018. Arrests for curfews, truancy, running away, drinking, incorrigibility, and other age-based “status” offenses aimed at controlling youth declined by 70 percent over the period.

Reduced youth incarceration continues to yield substantial cost savings.

The 64 percent decline in state-level incarcerations of youth over the last two decades has resulted in approximately $435 million in cumulated state budget savings since 2001 for youth detention costs alone, which continue to accrue at $45 million per year (in inflation-adjusted 2019 dollars). Total cost savings to state and local justice systems, though difficult to calculate directly, will be considerably higher.

Despite reductions in crime by youth, substantial disparities remain.

Racial and local disparities in juvenile justice outcomes remain stubbornly high. Black youth are three times as likely to be arrested than White youth, and Native youth are two and a half times more likely to be incarcerated when arrested than are White youth. These disparities, as well as local disparities in arrest, are largely unexplained by differences in crime.

Conclusions.

The large decline in juvenile crime, which accompanies similarly encouraging decreases in gun killings, school dropout, and other measures across the state and nation, requires further analysis to pinpoint causal factors. Potential factors appear to be generational in nature and include greater commitments to education among today’s young people, youths assuming greater family responsibilities, decreased environmental neurotoxins like lead, unexpected positive effects of online cultures, and certain early intervention policies.

Recommendations.

The fact that many fewer youth are entering the justice system in the first place indicates sharply reduced future needs for youth and adult prisons and affords historic opportunities to build on recent criminal justice reforms. Reducing racial and local arrest and incarceration disparities not founded in real crime trends remain important challenges. Designing policies to tailor justice processes and outcomes to individual characteristics and circumstances appear likely to contribute to more favorable outcomes. Proactive measures to reduce youth poverty, enhance education opportunity and access to services, address generational trauma and mental health difficulties, and replace outmoded misinterpretations regarding adolescent development with modern analyses.

Introduction

Criminal arrests and violence are plummeting among Oklahoma’s children and youth (Figure 1).1 Since their 1990s peaks, total arrests have fallen by two thirds, and the rate of homicide deaths of youth have been cut in half. This trend has significant long-term benefits, since those who are arrested at early ages are more likely to develop chronic offending patterns. A seminal study of life course offending found that “childhood delinquency is linked to adult crime, alcohol abuse, general deviance,” and a host of troubles later in life.2 While most people with repeat arrests and incarceration were first arrested in adulthood, those arrested in childhood and early adolescence have much higher odds of future justice involvement.3,4

Oklahoma has had a larger drop in arrest rates among youth (-86 percent through 2018) for serious, Part I violent and property offenses (homicide, rape, robbery, aggravated assault, burglary, larceny-theft, motor vehicle theft, and arson) since the early 1990s than occurred nationally (-78 percent through 2017), though every state experienced significant declines.6 While Oklahoma’s major declines in youth crime have not been widely discussed, they have had significant impacts on policy, budgets, and the structure of juvenile detention.7

One salient effect has been fiscal. Since 2001, the budget for the Office of Juvenile Affairs (OJA) has fallen by 35 percent, including a 58 percent decline in its budget for residential detention as the number of juveniles in detention has fallen by 61 percent. This reduction has totaled $40 to $50 million annually in savings in reduced incarcerations alone (Figure 2; constant 2019 dollars).8 OJA has also consolidated its seven levels of juvenile detention operated prior to 2002 into two types today: institutions and “Level E” group homes. The more restrictive placement is in institutions, which are “are locked and fenced facilities that provide OJA’s most intensive level of residential programming… reserved for youth whose behavior represents the greatest risk to themselves and the public.”9 In 2018, Oklahoma institutions held 169 youth.

The other type of detention facility, Level E group homes, now hold 94 youths and feature “highly structured environment and regularly scheduled contact with professional staff,” along with crisis intervention for youth displaying “extreme antisocial and aggressive behavior, and… emotional disturbances as well.” 10 A few youth remain in Specialized Community Homes.

In the peak year of juvenile confinement, 1999, three-fourths of the 757 incarcerated youth were held in institutions or Level E facilities, and one-fourth in five less restrictive settings. Today, 97 percent of the 270 detained youth are held in institutional or Level E facilities and fewer than 3 percent are in the least-restrictive, specialized community home placements.
These trends reflect the fact that as juvenile crime declines and as reforms divert lower-level offenders to non-incarceration alternatives and reduce the need for less-restrictive forms of detention, the smaller number of youths being incarcerated have a higher proportion of violent and chronic offenders requiring intensive supervision. This change in the structure of detention is one reason the costs per incarcerated youth have risen to such high levels (approximately $118,000 per year) and presents challenges for facility staff to manage a smaller but more troubled incarcerated population.

Oklahoma’s large decline in juvenile arrests, violence

Oklahoma has seen a long, continued decline in juvenile arrests and violence. Since their 1990 peak, rates of total arrests of Oklahoma youth under age 18 have fallen by 67 percent, including declines of 70 percent in felony violent crimes and 86 percent in property felonies. Drug offenses rose until around 2000 and have since declined by 45 percent. Paralleling the drop in crime by youths, homicide deaths among ages 10-17 have fallen from an average of 21 per year in the 1990s to 13 per year by 2016-18, a 50 percent drop when adjusting for population growth. In particular, rates of serious, Part I violent and property felonies fell by over 80 percent among each race (Figure 1).

These large decreases in crime and homicide occurred as immigration and growth of Native American populations made youth populations more diverse.10 The proportion of youth who are nonwhite rose from 25 percent in 1990 to 43 percent today.11 This overall increase was driven by large increases in Hispanic and Asian immigration and rising Native American populations. From 1990 to 2019, the population ages 10-17 increased by approximately 75,000 more Hispanics and Asians, 12,000 more Native Americans, and 8,000 more African Americans, while the White youth population decreased by 25,000. Hispanic and Asian populations not only show the largest declines in violent crime rates, they also are the only ones to show declines in violent death rates.

Most encouraging, rates of arrests by the youngest Oklahoma youth – those under age 13 – have fallen by 92 percent since 1990. In 1990, 3,000 children ages 12 and younger were arrested for criminal offenses, including 1,709 Part I (felony violent and property) offenses; in 2018, in a larger child population, there were just 655 arrested, including 160 for Part I offenses. The Appendix and Table 1 detail arrests and rates by age.

The decline in juvenile crime is yielding decreasing incarceration and significant cost savings

The Oklahoma Office of Juvenile Affairs12 recognizes that incarcerations of youth have also fallen precipitously for every race (Figure 3). The OJA counts of average daily populations in juvenile facilities decreased sharply from the 1999 peak of 757 to 270 in 2018 – a 69 percent decline in the rate of incarceration adjusted for the growth in Oklahoma’s juvenile population over the period. Placements of youths under age 15 in state detention fell from 128 in 1999 to just 14 in 2018, a decline of 86 percent.

Despite declines, significant racial and local disparities in juvenile arrests persist

Racial disparities.

Throughout the last four decades for which statistics are available, the arrest rate for Oklahoma’s Black youth has been three to five times higher than for other races. Even after sharp reductions in crime and violence by youth, a Black teenager in 2017 remained twice as likely to be arrested for drugs, six times more likely to be arrested for a violent crime, and three to four times more likely to be arrested overall than youth of other races (see Figures 1, 4). White, non-Hispanic youth have Oklahoma’s second highest arrest rate among juveniles, 1.3 times the rate for Hispanic youth, 2.4 times the rate for Native American youth, and 5.1 times the rate for Asian youth.

The justice system magnifies racial disparities from arrest to imprisonment. Oklahoma’s Black youth were 3.5 times more likely to be arrested for a criminal offense in 2018 but 6.4 times more likely to be incarcerated than youth of other races. Black-youth incarcerations have declined more slowly (down 46 percent since 1999) than among other races (down 73 percent) (Figures 3, 4).

A second racial disparity is that Native American youth have incarceration rates per arrest much higher than for other races. Native youth incarcerations totaled 9.7 percent of Native youth arrests in 2018, compared to 4 percent for Blacks, 2.3 percent for Hispanics, and 1.5 percent for Whites. Despite their higher arrest rates, Whites have lower levels of incarceration than Hispanic youth, and much lower than Native youth.

Are these disparities the result of real differences in offending by race, or of racial bias within the criminal justice system? A comprehensive analysis would require long-term, Oklahoma-specific study of arrests and sentencings for equivalent offenses by race, but we can use public health statistics to estimate what juvenile arrest rates should be if arrests paralleled measurable outcomes related to crime, such as homicide and illicit-drug deaths. For example, if there were no race-driven disparities in the justice system, we would expect rates of homicide death to be lower for members of a race with a lower rate of arrests for violent crimes. This method is limited but justified if the overarching goal of the legal system is to prevent unwanted outcomes.

Our analysis of the 233 homicide deaths and 107 illicit-drug abuse deaths14 among Oklahomans ages 10-17 for the 1999-2018 period shows that Black youth are 5.4 times more likely to suffer homicide death, but 46 percent less likely to suffer drug death, than youth of other races. Conversely, non-Hispanic White youth are 1.8 times more likely to suffer fatal illicit-drug abuse than youth of other races. Arrest rates for Whites for violent offenses parallel their homicide death rates but are only slightly higher for drug offenses compared to respective levels among other races.

Similarly, the pattern of offending does not explain why Native American youth are so much more likely to be incarcerated once arrested. Native American juvenile arrest totals have no higher proportions of serious violence, felony property, or felony drug offenses (those most likely to lead to incarceration) than other races, nor do Whites have lower proportions of those offenses.

From this examination, it appears that Blacks’ excessive involvement with the criminal justice system, from arrest to incarceration, is a major issue for drug offenses in particular and is not explained by racial patterns in drug abuse. Further, Native Americans’ excessive incarceration rate per arrest is not explained by differing racial patterns in seriousness of offense. Previous studies have found historical justice system disparities affecting these two racial groups, with particularly high arrest levels in rural areas.15

Local disparities.

Oklahoma counties also show large discrepancies in juvenile arrests. Figure 5 ranks counties by juvenile Part I offense arrests per 100,000 youths age 10-17 (only the 39 counties with 2,500+ youths are shown to avoid the radical values produced by small counties).

Kay County consistently stands out as a radical outlier, with juvenile arrest rates now five times the state average. Kay County’s juvenile arrests totaled 11.3 percent of its youth population (557 arrests in a population of 4,905 age 10-17) in 2018, compared to 2.2 percent of the juvenile population in other counties. Local law enforcement responses to difficulties surrounding the Marland Children’s Home in Ponca City for severely disadvantaged and abused teenagers, where a majority of residents had been charged with offenses, almost certainly accounts for some, but not all, of the discrepancy.16 It is also not clear why arrest rates of youths in Carter and Pottawatomie counties are so much higher than in nearby counties like Stephens and Seminole, which are similar in demography and poverty level. Unlike other states, Oklahoma shows no relationship between county youth poverty and arrest levels.

OJA’s 2016 report indicates that Tulsa County, with 17 percent of the state’s youth and 13 percent of juvenile arrests, accounts for 20 percent of referrals to OJA facilities. In contrast, Oklahoma County, with 20 percent of youth and 21 percent of youth arrests, accounts for just 9 percent of referrals to OJA. The reasons for Tulsa’s much greater referral rate per youth and per arrest should be examined.

Conclusions and policy implications

The decline in youth crime since 1990 now saves Oklahoma $40 to $50 million per year in juvenile incarceration costs alone.* There is considerable room for additional reductions in incarceration costs. If the proportion of property, drug, public-order, misdemeanor, and technical-violation incarcerations were reduced to no more than around 30 percent of facility populations, and if racial disparities in drug arrests and confinements were made consistent with public health outcome measures, it would be possible to further reduce state juvenile facility populations and save additional tens of millions of dollars.

*It costs approximately $118,500 in facility costs to incarcerate one youth for a year ($32 million for the 2019-20 residential facilities budget divided by 270 youth in the average daily population).20

There appears to be no need to increase the capacity of Oklahoma’s juvenile or adult prison system in the forseeable future, though upgrading substandard facilities remains important. The new $48 million, 144-bed juvenile facility being built near Tecumseh for operation in 2020 is intended to replace old facilities that OJA admits are deficient.19

The potential rewards of reforms that incorporate encouraging trends among Oklahoma youth are great. The large decline in arrests of youth, now spreading into young adulthood as the low-arrest generations of the 2000s age, holds strong promise for reducing Oklahoma’s high rate of adult imprisonment. A combination of harsh sentencing policies and a Baby Boom/Generation X cohort that had much higher arrest levels throughout their lifespans has produced among the nation’s highest rates of imprisonment. The aging of this generational effect can be seen in the fact that the only age group to show higher arrest rates for serious offenses in 2018 than in 1990 are 35-59 year-olds (Table 1). Note that while youths ages 10-17 had the highest arrest rate in 1990, today the arrest rate of youths is below that of adults age 45-49.

These crime trends have not been studied in Oklahoma. If trends are analyzed for causal factors, Oklahoma may have the chance to virtually eliminate child crime (just 41 of the state’s 267,000 children ages 5-9 were arrested for any offense in 2018, down from over 1,000 in 1985) and shift more resources to a criminal justice system oriented to community-based drug/alcohol treatment and rehabilitation services suited to an aging arrestee population.

Reform principles.

In pursuing reforms, it is important to recall that the original purpose of juvenile justice is to offer a flexible continuum of services, including detention, counseling, treatment, and supervised and unsupervised probation tailored to the individual arrestee’s offense, characteristics, and environment – all aimed at return to society. “Individualized justice” is an ideal not just for the juvenile system, but for the adult criminal system as well.

For that reason, it is important to avoid outdated biodevelopmental arguments holding that children’s and teenagers’ innate developmental stage and cognitive biology impair their moral reasoning, impulse control, and susceptibility to peer pressure, rendering young ages inherently prone to crime.10 Such claims are proving both statistically questionable (adolescent crime rates have plunged to levels equivalent to those of middle-agers) and scientifically dubious (large-scale reviews have called into question the functional Magnetic Resonance Imaging findings21 underlying the “science” of brain development). Worse, these negative stereotypes de-individualize children and adolescents and have accompanied generally harsher measures toward younger offenders,22 including longer incarcerations for equivalent offenses than adults receive.

Oklahoma already compares favorably to the best “reform” states in reduced rates of crime and incarceration by youths as well as current crime levels. As of 2015 and after, Oklahoma authorities have already largely eliminated incarceration for status offenses; however, the proportion detained for nonviolent offenses remains high. Reducing detentions for property, drug, public order, and “technical violations” offer opportunities for reducing the incarcerated juvenile population further. Reducing excessive arrests and detentions of African American youth for drug offenses, reducing excessive levels of Native American youth incarcerations per arrest, and ameliorating very large local disparities in juvenile arrest rates are additional targets for reform. Model local practices may be found from analyzing counties with low rates of juvenile arrest, such as Choctaw, Hughes, and Seminole.

Criterion-based standards.

One promising reform to advance individualized justice would be more flexible, criterion-based standards. Juvenile courts would be repurposed as rehabilitation/reintegration systems to handle offenders of all ages whose criminal behaviors are adjudged of lower level and stem from environmental factors such as poverty, family trauma, addiction, and mental health issues. In practice, a criterion-based system would be likely to receive more younger, first-time, and lesser-offense arrestees whose evaluations indicate mitigating factors.

The criminal justice system would continue as an adversarial system emphasizing public safety and justice-oriented sentencing. In practice, it would handle more chronic and violent arrestees whose evaluations indicate aggravating factors. Those sentenced by the criminal system could petition for transfer to the rehabilitative system based on behavior. Those managed by the rehabilitative system who are found to be unsuitable could be transferred to criminal court jurisdiction.

The large declines in juvenile crime afford historic opportunities for reform and realignment of the justice system in ways that fit 21st century realities rather than 19th and 20th century anachronisms. Oklahoma’s trends and recent reforms in drug and property crime policies offer the state the opportunity to become a national leader in criminal justice innovation.

Appendix A: The Changing Structure of Youth Arrests

Since the 1980s, arrests of children under age 10 have been plummeting steadily:

  • In 1988, 1,013 children under age 10 were arrested, including 509 for serious Part I violent and property felonies;
  • By 2000, 505 and 215, respectively;
  • In 2018, 41, including 10 for Part I felonies.

Similar trends occurred a few years later among teens age 10-14…

  • In 1995, 9,134 younger teens were arrested, including 4,896 for Part I felonies;
  • In 2018, 2,988, including 627 for Part I felonies.

…then high-school teens age 15-17…

  • In 1997 and 1998, nearly 20,000 high-school-age teens were arrested annually, including 7,400 for Part I felonies;
  • In 2018, around 7,000, including 1,500 for Part I felonies.

…then, still later, young adults ages 18-24, whose arrests fell from 48,000 in 2000 to 22,500 in 2018 (down 55 percent). Recently, ages 25-39 are showing declines as well as Oklahoma’s post-1988 plummet in child crime has moved into teenage and young-adult generations. This trend is likely to bring down crime still more among both younger and middle-adult ages in the near future.

Appendix B: Oklahoma youth arrests for Part I violent/property felonies per 100,000 population age 10-17 by race, 1980-2017

References

1 Oklahoma State Bureau of Investigation. Crime Statistics 2002-2017. At: https://osbi.ok.gov/publications/crime-statistics. State of Oklahoma Uniform Crime Report 1977-2009. http://digitalprairie.ok.gov/cdm/compoundobject/collection/stgovpub/id/4911/rec/1

2 Sampson, R.J., & Laub, J.H. (1990). Crime and deviance over the life course: The salience of adult social bonds. American Sociological Review, 55:5, 609-627.

3 DeLisi, M. (2006). Zeroing in on early arrest onset: Results from a population of extreme career criminals. Journal of Criminal Justice, 34:17–26.

4 Miller, J. D., & Lynam, D. (2001). Structural models of personality and their relation to antisocial behavior: A meta-analytic review. Criminology, 39, 765–798.

5 Oklahoma State Bureau of Investigation. Crime in Oklahoma 2018. At: https://osbi.ok.gov/statistical-analysis-center/publications. Crime Statistics 2002-2017. At: https://osbi.ok.gov/publications/crime-statistics. State of Oklahoma Uniform Crime Report 1977-2009. http://digitalprairie.ok.gov/cdm/compoundobject/collection/stgovpub/id/4911/rec/1

6 Federal Bureau of Investigation (2018). Crime in the United States, 1995-2017. Table 69 in 2017 and previous corresponding table. At: https://ucr.fbi.gov/crime-in-the-u.s/

7 Oklahoma Institute for Child Advocacy (2014). Issue Brief: A Fiscal Analysis of Juvenile Justice in Oklahoma. At: http://oica.org/wp-content/uploads/2014/11/oja-fiscal-analysis-edits3.pdf

8 Office of Management and Enterprise Services (2019). State of Oklahoma. Budget Books. At: https://www.ok.gov/OSF/Budget/Budget_Books. html. https://omes.ok.gov/sites/g/files/gmc316/f/publications/bud20.pdf

9 Office of Juvenile Affairs (2019). Residential treatment program. At: https://www.ok.gov/oja/Residential_Treatment_Centers/index.html . See also: http://www.oksenate.gov/publications/overview_of_state_issues_2000/juvenile_justice.pdf

10 OK2SHARE (2019). Death data. Oklahoma Department of Health. At: https://www.ok.gov/health/Data_and_Statistics/Center_For_Health_Statistics/Health_Care_Information/Vital_Statistics/Vital_Statistics_Data_and_Reports/index.html

11 OK2SHARE (2019), op cit.

12 Office of Juvenile Affairs (2019). Fast Facts. At: https://www.ok.gov/oja/documents/2016%20OJA%20Annual%20Report.pdf

13 Office of Juvenile Affairs (2018), 2018 age, race, and type of youths in state facilities, 1997-2018, provided by request.

14 Ok2SHARE (2019), Ibid.

15 Hill. C.M. (2004). An analysis of juvenile justice decision-making and its effect on disproportionate minority contact. OU dissertations {7076]. At: https://hdl.handle.net/11244/708

16 Cosgrove J, Bailey B (2017). Oklahoma DHS group homes are riddled with assault, crime and chaos, officials claim. The Oklahoman, April 2, 2017. At: https://newsok.com/article/5543784/oklahoma-dhs-group-homes-are-riddled-with-assault-crime-and-chaos-officials-claim

17 Office of Juvenile Affairs (2019). Fast Facts. At: https://www.ok.gov/oja/documents/2016%20OJA%20Annual%20Report.pdf

18 Oklahoma State Bureau of Investigation (2018). Crime in Oklahoma 2017. Table 37. At: https://osbi.ok.gov/file/4866/download?token=RE8dxp31

19 Ellis, R. (2018). Plans advance for next generation campus for juvenile offenders in Tecumseh. Daily Oklahoman, May 13, 2018. At: https://newsok.com/article/5594260/plans-advance-for-next-generation-campus-for-juvenile-offenders-in-tecumseh

20 Males M (2017). Plummeting youth crime demands new solutions, thinking. Juvenile Justice Information Exchange. At: https://jjie.org/2017/10/02/plummeting-youth-crime-demands-new-solutions-thinking/

21 Science Alert (2016). A bug in fMRI software could invalidate 15 years of brain research. July 6, 2016. At: https://www.sciencealert.com/a-bug-in-fmri-software-could-invalidate-decades-of-brain-research-scientists-discover

22 Macallair D (2015). After the Doors Were Locked: A History of Youth Corrections in California and the Origins of Twenty-First Century Reform. Rowman & Littlefield.

About the Author

Criminal Justice Policy Consultant, Mike Males

Mike Males was commissioned by Oklahoma Policy Institute to do special reports on crime and social policy in November 2018. He grew up in Oklahoma City in the 1950s and 1960s and graduated from Occidental College in Los Angeles with a BA in political science in 1972. He worked as a longshoreman and community organizer in New Orleans, a recycling depot manager and research analyst in Portland, Oregon, and an environmental lobbyist and journalist in Montana for 14 years. Males worked with youth and families in community programs and as a crew leader in the Youth Conservation Corps during the 1980s and 1990s before returning to school, earning a Ph.D. in social ecology from the University of California, Irvine, in 1999. He authored four books and scores of journal articles and articles on youth issues and taught sociology at UC Santa Cruz. He currently lives in Oklahoma City and works online as senior research fellow for the Center on Juvenile and Criminal Justice, San Francisco.

SB 252 bail reform could save counties & communities millions

Oklahoma’s money bail system incurs millions of dollars in fees to our most vulnerable communities and keeps thousands of our citizens incarcerated each year because they can’t afford to bond out. People accused of nonviolent offenses1 can spend weeks or months in jail, costing counties millions of dollars with no benefit to public safety.

SB 252 would ensure that people accused of misdemeanors or nonviolent felonies are considered for unsecured release and are detained only if they pose a specific threat to public safety or have a history of failing to appear for their court date.

Analysis of court data2 shows the damage our current system of money bail does to individuals and communities:

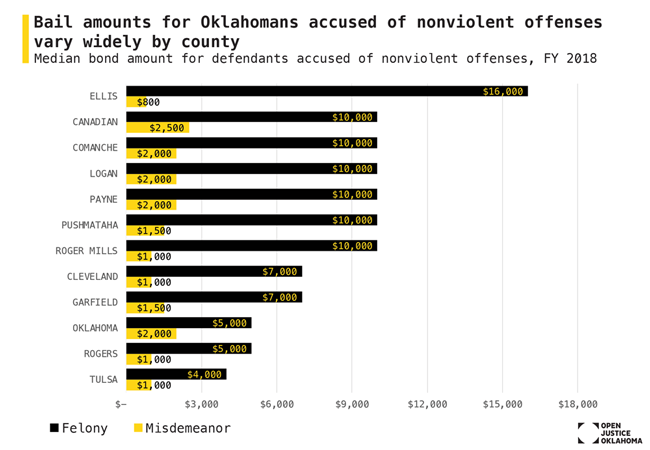
Money bail amounts vary greatly from county to county.

The median bond amount for people accused of nonviolent misdemeanors varies from a low of $800 in Ellis County to a high of $2,500 in Canadian County. The median bond amount for people accused of nonviolent felonies ranged from a low of $4,000 in Tulsa County to as high as $10,000 or more.

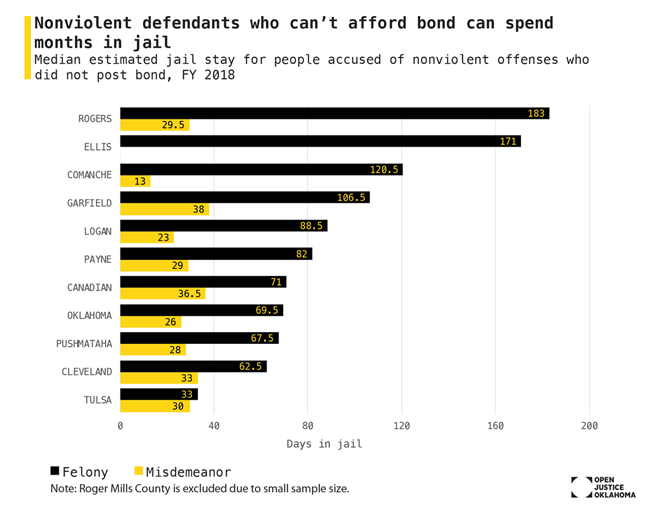
Defendants who cannot post bond spend weeks or months in jail even though they haven’t been convicted of a crime.

People accused of nonviolent misdemeanor offenses spend 2 to 6 weeks in jail before their case is resolved if they cannot afford their bond. In some counties, the average person accused of a nonviolent felony spends nearly six months in jail.

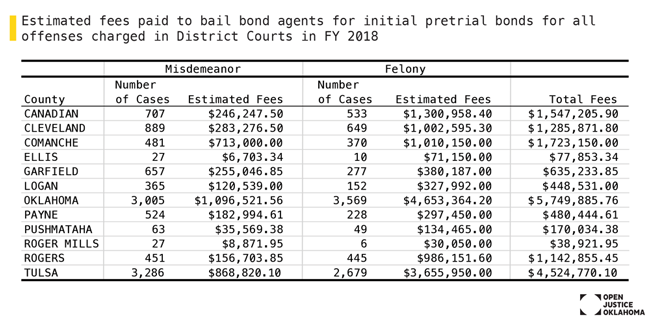
Money bail drains wealth from our most vulnerable communities.

Bail bond agents typically charge a nonrefundable fee of 10 percent to secure a person’s bond. These fees take millions of dollars from Oklahomans accused of crimes each year, even if their charges are dismissed or they are found not guilty.

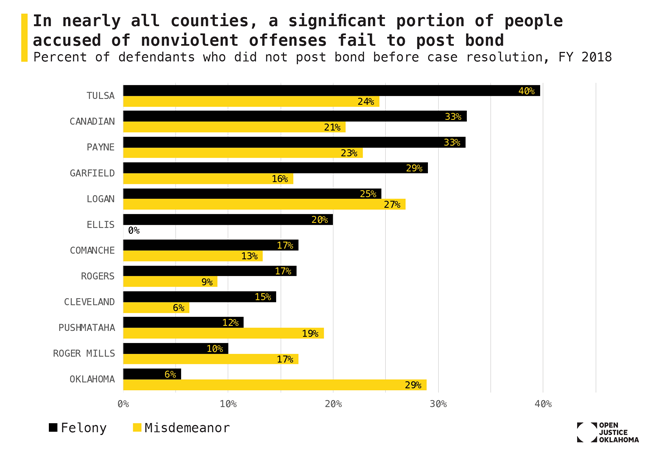
Many defendants can’t afford to bond out.

One in four nonviolent misdemeanor defendants in Pushmataha and Logan Counties remains in jail until their case is disposed. One in three people accused of nonviolent felonies in Canadian and Payne counties, and two in five defendants in Tulsa County, remain in jail until the disposition of their cases.

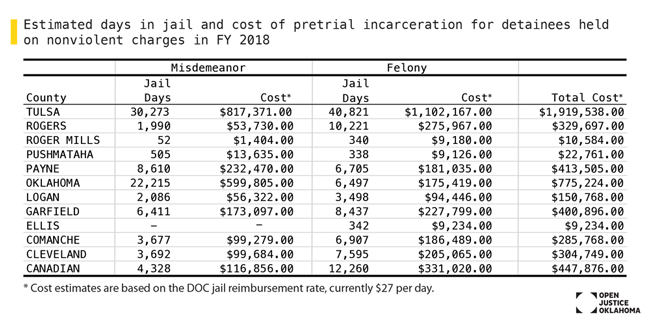
Counties could substantially reduce jail costs through smart pretrial reforms.

SB 252 would ensure that people who are accused of nonviolent offenses and are not a flight risk would be granted recognizance bonds. Many counties could realize savings of several hundred thousand dollars per year by releasing these defendants in a timely fashion without monetary conditions.

How we estimated pretrial outcomes with court data

The bail fact sheets by Open Justice Oklahoma analyze records collected from the Oklahoma State Court Network (OSCN) to estimate the impact of pretrial jail policy and practices for cases filed during Fiscal Year 2018 (July 1, 2017 to June 30, 2018). We analyzed data from 12 of the 13 counties that store comprehensive court records on the Oklahoma Court Information System. Adair County was excluded because bond amounts for defendants who do not post bond are not available.

Court records for each defendant within each case were collected and analyzed to estimate the date that the defendant was booked into jail, if any, and the date that the person was released.

We used a combination of docket minute dates, offense dates, and other clues within court records to estimate a defendant’s date of booking and release from jail for their initial pretrial stay. For example, if a person was arrested, posted bond, failed to appear for a court date, was rearrested, and posted bond again; this data includes only the first arrest and bond.

Each docket entry minute was coded to infer the status of a person on the date of the minute. Classifications include: bonded out (cash, surety, or recognizance), arrested (when a warrant was returned), disposed (convicted, dismissed, or deferred), had bond set, appeared in court, was in custody, or was out of custody. The order of these dates was analyzed to identify the likely date of booking, usually the date of offense (44% of cases) or a warrant (32%). We then identified the likely date of release, most often when money bond was posted (50% of cases), a recognizance bond was issued (12.5%), or the case was disposed (16%).

To check our results, summary data generated by this method for Tulsa County in 2016 were compared to the results of jail data analyzed by the Vera Institute. The comparison suggests that our method comes very close to data reported by Vera for most offenses, while at times over- or underestimating stays for certain offenses.

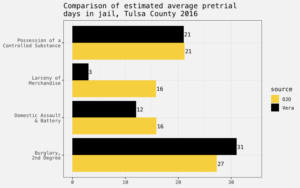
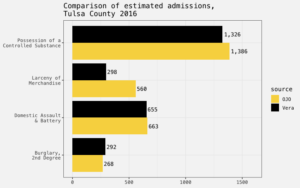
The discrepancies between the stay data generated from OSCN records by OJO and the analysis of jail data by Vera are likely due to a combination of factors:

  1. Differences in controlling charges: We used the first charge listed on court records as a proxy for the most serious charge, while Vera used the count with the highest bond amount.
  2. Incomplete or erroneous records: Data input errors mean that both jail records and court records often do not contain all the information necessary to decode the underlying factors in a case.
  3. Differences in charges at arrest and case filing: After a person is arrested, they are booked into jail on charges for which officers have determined there is probable cause. These are often the same as the charges a prosecutor files against a person, but prosecutors can add or drop charges based on the evidence. The difference between the charges at each step affect our ability to match trends.

Despite these considerable limitations, length of stay data generated by this method are comparable to jail data used by the Vera Institute. In the absence of better data from the facilities themselves, court records allow us to estimate the impact that bond and pretrial practices have on county and municipal governments and individuals who are accused of a crime.

Using the Oklahoma County Justice Dashboard

Open Justice Oklahoma is proud to present its first data project, the Oklahoma County Justice Dashboard. The dashboard allows users to explore a wide range of data about the workings of the local justice system in Oklahoma County. There are two main components:

  • The Jail Admissions tab displays data about the people coming into the Oklahoma County Jail each month: the type of offense (drug, property, etc.), level (felony, state misdemeanor, or municipal misdemeanor), and arresting agency for each person